
📊 Full opportunity report: The $725 Billion Question: Hyperscaler Capex Q1 2026 and What the Earnings Don’t Answer on ThorstenMeyerAI.com — validation score, market gap, and execution plan.
TL;DR
In Q1 2026, Microsoft, Amazon, Alphabet, and Meta disclosed a combined AI capital expenditure of approximately $725 billion, the largest in history. Despite strong spending, market concerns about the actual revenue impact and future profitability are growing.
The four largest hyperscalers—Microsoft, Amazon, Alphabet, and Meta—disclosed a combined AI-related capital expenditure of approximately $725 billion in Q1 2026, marking the largest such investment in modern corporate history. This surge in spending underscores the industry’s aggressive push into AI infrastructure but raises questions about the actual revenue and earnings growth that will result.
Microsoft announced a full-year 2026 capex guidance of around $190 billion, with a focus on GPUs and CPUs to meet capacity constraints driven by AI demand. Amazon reported a Q1 capex of $44.2 billion, reaffirming its $200 billion guidance for 2026, with a notable shift toward in-house silicon like Trainium and Graviton, reducing dependency on NVIDIA. Alphabet’s Q1 capex reached $35.67 billion, more than doubling YoY, with a significant focus on custom AI silicon (TPU v6) and a cloud backlog exceeding $460 billion. Meta’s capex guidance was raised to between $125-145 billion, with component pricing pressures influencing their spending plans.
Overall, the combined capex of the Big Four increased 69% YoY, reaching an estimated $700-725 billion, representing the largest capital deployment in tech history. This investment is driven by the quest to dominate AI infrastructure and support the rapid growth of API and cloud services, but the market is questioning whether this spend will translate into proportional revenue and profit gains, especially given recent stock reactions and structural industry shifts.
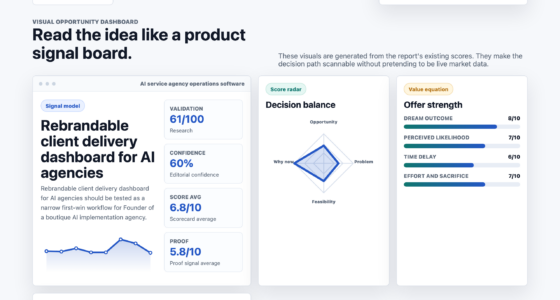
$725 billion. The question capex doesn’t answer.
April 29, 2026. Largest capital-expenditure cycle in modern tech history. Lock-in across the Big Four.
Microsoft $190B. Amazon $200B. Alphabet $185B. Meta $125-145B. Up from $670B high-end consensus going in. +69% YoY surge over 2025. NVIDIA fell on the news. The structural questions — depreciation, power, in-house silicon, demand-pull, geopolitical — resolve through 2027-2028.
Four hyperscalers. $725B committed.
Each hyperscaler beat-and-raised in the same 24-hour window April 29. Microsoft / Amazon / Alphabet / Meta. The capex commitment is non-discretionary at this scale — companies cannot back out without creating asset write-downs and capacity gaps.

High-Performance AI Systems Engineering: Techniques for Faster Model Training, Efficient GPU Workloads, Distributed Computing, and Reliable AI Deployment across Modern Infrastructure
As an affiliate, we earn on qualifying purchases.
As an affiliate, we earn on qualifying purchases.
Three paths. One question.
The capex buildout resolves through one of three structural paths. The honest assessment: the demand signals are real, the supply signals are real, and the balance between them is the structural question.
- Demand +60-100% YoYEnterprise translates fully.
- Utilization 85%+NVIDIA pricing power holds.
- $2.8T by 2028Jensen trajectory matches.
- No impairmentCapex fully accretive.
- Outcome: Multiples expand. Foundation for next decade.
- Demand +30-60% YoYPartial translation.
- Utilization 75-85%Weaker pockets visible.
- NVDA decel 75% → 30-50%Manageable adjustment.
- $30-80B impairmentLimited 2028 cycles.
- Outcome: Multiples compress modestly. No crisis.
- Demand +15-30% YoYEnterprise falls short.
- Utilization 65-75%Capacity glut visible.
- $150-300B impairmentBig Four 2027-2028.
- NVDA sharp decelPricing compression.
- Outcome: 30-50% multiple compression. Post-2001 telecom analog.

SQL Server 2025 Unveiled: The AI-Ready Enterprise Database with Microsoft Fabric Integration
As an affiliate, we earn on qualifying purchases.
As an affiliate, we earn on qualifying purchases.
Five vectors. Interdependent.
Capital-allocation risks of this magnitude resolve through specific structural channels. The vectors are not independent — power constraints delay deployment which compresses utilization which triggers impairment.
Capital intensity has reset upward as the new baseline for tech-platform leadership. The competitive moat is partly capital availability rather than purely product or technology innovation. Tech-platform leadership now requires capital-deployment scale that fewer companies can execute.

Revolution of AI Blueprints : The Twilight of ARM and the Rise of RISC-V
As an affiliate, we earn on qualifying purchases.
As an affiliate, we earn on qualifying purchases.
Four assignments. By role.
Reset on structural pricing-power compression.
Bull case requires NVIDIA to maintain addressable share through FY27-FY28; in-house silicon migration argues that share compresses. Position accordingly. Consider AMD, Broadcom, downstream networking suppliers as partial substitutes that may benefit from compression. Stop pricing the $2.8T-by-2028 ceiling literally.
Treat capex as tailwind and risk factor.
Microsoft best-positioned through capacity-constrained Azure demand. Alphabet best-positioned through TPU silicon independence. Amazon best-positioned through Trainium/Inferentia revenue diversification. Meta most exposed through internal-product-only revenue offset. Position differentially rather than treating Big Four as equivalent.
Use the buildout to negotiate.
Capacity becoming abundant; pricing under structural pressure. 2-3 year contracts with capacity guarantees + price-discount escalators that capture unit-cost reduction as buildout absorbs. Multi-cloud sourcing more attractive as capacity scarcity ends. The negotiating window opens through 2026-2027.
Plan for capacity glut by H2 2027.
Capex commitment produces more compute than current demand absorbs at current pricing. API pricing pressure compounds through 2027-2028. China sphere cost gap (5-30× cheaper) makes more acute. Margin guidance for next 18 months should explicitly model capacity-driven price compression. Hedge accordingly in S-1 disclosures.

The Cloud Has Hit the Ground: Data Centers, AI, and the Fight for America’s Infrastructure Future
As an affiliate, we earn on qualifying purchases.
As an affiliate, we earn on qualifying purchases.
Implications of Record-Breaking AI Capex for Investors
This historic surge in AI infrastructure spending signals a fundamental shift in the tech industry’s growth strategy, with hyperscalers outspending their free cash flow and raising debt to fund AI buildouts. While this positions them to potentially dominate AI markets, it also introduces significant risks: if the expected revenue growth does not materialize, companies could face impairments or profit compression in subsequent years. The market’s recent stock reactions, especially NVIDIA’s decline despite record revenues, highlight the uncertainty surrounding the true return on this massive investment cycle.
Historical and Industry Context of AI Infrastructure Investment
Prior to 2026, hyperscalers increased their capex steadily, but the current quarter marks an unprecedented escalation—approaching $740 billion in total global AI infrastructure spending, according to Morgan Stanley estimates. The push is driven by the need to support AI workloads, which have become central to cloud services and enterprise solutions. Notably, NVIDIA’s data center revenue rose 75% YoY to $62.31 billion in Q4 fiscal 2026, yet its stock fell sharply post-earnings amid questions about GPU constraints versus other bottlenecks like power, cooling, or custom silicon. Past industry cycles show that such massive investments often lead to a period of revenue realization lag, raising concerns about whether current capex levels are sustainable or overextended.
“Our plan remains largely unchanged, with a $200 billion capex target for 2026, and we are shifting more workloads to in-house silicon.”
— Andy Jassy, Amazon CEO
“Our TPU v6 ramp through 2026 will determine how much of our compute can be served without NVIDIA.”
— Sundar Pichai, Alphabet CEO
Uncertain Revenue and Profit Impact of Massive Capex
While the capex figures are confirmed, it remains unclear whether this investment will translate into the revenue and earnings growth that markets expect. The recent decline in NVIDIA’s stock despite record revenues illustrates market skepticism about the bottleneck constraints and the actual return on this capital deployment. Questions persist about whether GPU supply, power, cooling, or proprietary silicon will become the dominant constraints, and whether current spending levels are sustainable if revenue growth slows or fails to meet expectations.
Monitoring Revenue Growth and Industry Adjustments
Investors and industry analysts will closely watch upcoming earnings reports from the hyperscalers for signs of revenue growth, especially in cloud and AI services. The next few quarters will reveal whether the current capex cycle sustains its momentum or leads to impairments. Additionally, the industry will assess the effectiveness of in-house silicon strategies, the impact of component pricing pressures, and the evolution of GPU supply constraints. Regulatory and geopolitical factors, especially regarding China’s AI infrastructure, may also influence the ongoing investment landscape.
Key Questions
Why did hyperscaler capex surge so dramatically in Q1 2026?
The surge reflects an industry-wide push to dominate AI infrastructure, driven by the need to support rapidly growing AI workloads, API services, and cloud offerings. Companies are outspending their free cash flow and raising debt to build out capacity.
Will this massive investment translate into proportional revenue growth?
It is uncertain. While revenue from AI and cloud services is growing, recent market reactions, especially to NVIDIA, suggest skepticism about whether current capex will lead to expected earnings increases or if bottlenecks and structural shifts will limit returns.
What risks do hyperscalers face with such high levels of spending?
The primary risks include overcapacity, declining margins if revenue growth slows, and impairments if the investments do not generate expected returns. The industry’s reliance on GPU supply and proprietary silicon strategies adds further uncertainty.
How might this affect NVIDIA and other hardware suppliers?
While NVIDIA’s revenues are strong, market skepticism about GPU constraints and the rise of in-house silicon could impact future demand. The industry is also exploring alternative bottlenecks, such as power and cooling, which could alter hardware demand patterns.
Source: ThorstenMeyerAI.com