
Top GPs use post-investment dashboards to keep LPs engaged by providing real-time, visual insights into portfolio performance, including key metrics like revenue, EBITDA, and cash flow. These dashboards consolidate data, making it easy to spot trends, compare against industry benchmarks, and quickly identify issues. They also automate reporting, enhancing transparency and building trust. To discover more ways these dashboards support effective investor communication, just keep exploring how they shape ongoing success.
Key Takeaways
- Consolidate key performance indicators into a single interface for real-time portfolio monitoring.
- Automate data collection and reporting to ensure timely, accurate updates for LPs.
- Use visual dashboards to clearly communicate financial and operational health of investments.
- Incorporate trend analysis and benchmarking to highlight performance against industry standards.
- Facilitate strategic discussions and build trust by providing transparent, easy-to-understand metrics.
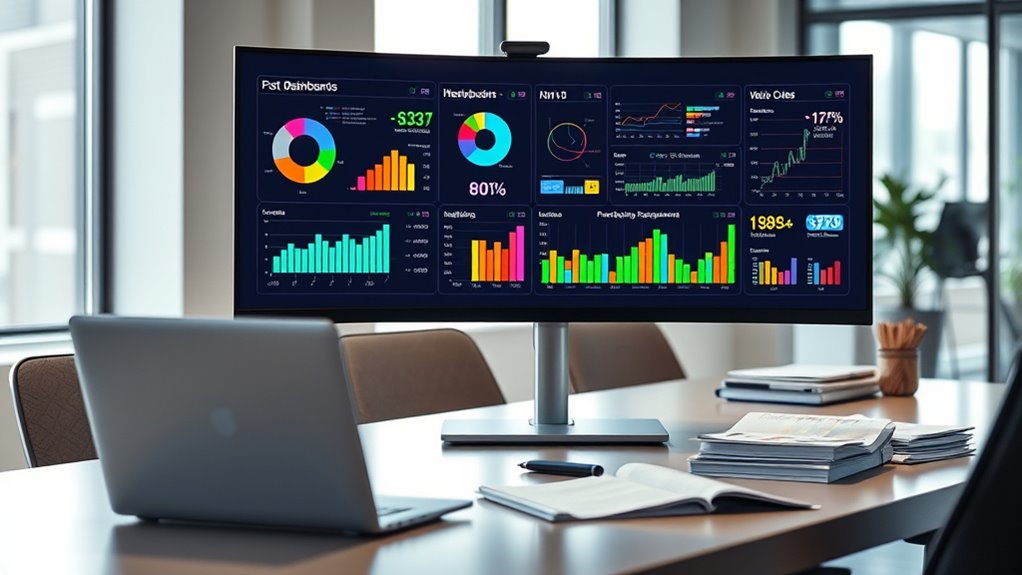
Effective post-investment oversight is essential for general partners (GPs) to maximize returns and mitigate risks. When you’re managing multiple investments, staying on top of performance metrics becomes critical. Post-investment dashboards are the tools that help you visualize and interpret data quickly, enabling informed decision-making. These dashboards compile key performance indicators (KPIs) into a single interface, giving you a real-time view of how each portfolio company is performing. By focusing on relevant metrics like revenue growth, EBITDA, cash flow, and operational efficiency, you can identify potential issues early and act swiftly. This proactive approach reduces the likelihood of surprises that could erode value down the line.
Reporting automation plays a significant role in maintaining transparency and efficiency. Instead of manually gathering data from disparate sources, you can automate the process to generate timely, accurate reports for your limited partners (LPs). Automated reporting not only saves you time but also minimizes errors, ensuring LPs receive consistent and reliable updates. With real-time data feeds, you can produce customized reports that highlight the most relevant information for each stakeholder. This level of transparency fosters trust and keeps LPs engaged, demonstrating that you’re actively monitoring their investments and responding to any concerns.
Another advantage of post-investment dashboards is their ability to facilitate communication. With clear visuals and consolidated data, you can present complex financial and operational information in an understandable way. This clarity makes it easier to explain investment progress, discuss challenges, or outline strategic adjustments. When LPs see up-to-date metrics displayed on intuitive dashboards, they gain confidence in your management approach. Plus, dashboards often include trend analysis and scenario modeling features, helping you project future performance and plan accordingly.
Incorporating performance metrics into your dashboards also enables you to benchmark investments against industry standards or internal targets. This comparative analysis pinpoints areas requiring improvement and highlights successes worth replicating. The automation of these insights ensures you’re consistently aligned with your investment thesis and strategic goals. Additionally, understanding fetal development during pregnancy emphasizes the importance of data tracking, which parallels how dashboards help monitor investment health. Ultimately, leveraging post-investment dashboards with robust reporting automation empowers you to stay vigilant, make data-driven decisions, and maintain strong relationships with your LPs. It’s a smart way to guarantee each investment remains on track and delivers the returns your stakeholders expect.
investment portfolio dashboard software
As an affiliate, we earn on qualifying purchases.
As an affiliate, we earn on qualifying purchases.
Frequently Asked Questions
How Do Dashboards Adapt to Different Types of Investments?
You can adapt dashboards to different investments by customizing investment visualization to highlight key metrics specific to each asset class. Incorporate data integration to seamlessly pull relevant data, ensuring real-time updates and accuracy. For example, private equity dashboards focus on valuation changes, while real estate dashboards emphasize property performance. Tailoring these visualizations helps you communicate effectively with LPs, keeping them engaged and informed about each investment’s unique performance.
What Security Measures Protect Sensitive LP Data?
Imagine you’re reviewing sensitive LP data; security measures are your first line of defense. You rely on data encryption to scramble information and prevent unauthorized access, much like locking your digital doors. Access controls ensure only authorized personnel can view or modify data, giving you peace of mind. Together, these security measures safeguard your LP data from breaches, keeping trust intact and maintaining the integrity of your investment information.
Can Dashboards Be Customized for Specific LP Preferences?
You can definitely customize dashboards to match specific LP preferences. By incorporating LP feedback, you guarantee the dashboard displays the most relevant data and metrics they care about. This tailored dashboard customization helps you keep LPs engaged and satisfied, as they see insights that matter most to their investment interests. Personalizing dashboards fosters stronger communication, builds trust, and makes your reporting more effective and impactful for each LP.
How Often Should Post-Investment Dashboards Be Updated?
You should update post-investment dashboards regularly, ideally monthly or quarterly, to guarantee LPs have access to the latest performance metrics. Maintaining a clear and intuitive user interface is essential, so updates are seamless and easy to interpret. Frequent updates help LPs stay informed about investment progress, build trust, and enable timely decision-making, making your dashboard a valuable communication tool that keeps them engaged and confident in your management.
What Are the Common Challenges in Implementing These Dashboards?
You might face challenges like data integration, where aligning different systems causes delays or inaccuracies. User training also poses issues, as team members need to learn new tools effectively. Ensuring seamless data flow and all-encompassing training are key to successful implementation. Without addressing these, your dashboards may become unreliable or underused, hindering your ability to keep LPs engaged and informed effectively.

CPA Financial Accounting & Reporting(FAR) Exam Quick Reference Guide: Key Concepts, Standards, Ratios & Mnemonics for CPA, ACCA, and Finance Students
Targeted Q&A Review – Covers 15 key questions per FAR section , including Conceptual Framework, Financial Reporting, Leases,…
As an affiliate, we earn on qualifying purchases.
As an affiliate, we earn on qualifying purchases.
Conclusion
Imagine walking through a vibrant control room, where each dashboard lights up with real-time insights, keeping you connected to your investments like a steady heartbeat. These post-investment dashboards are your window to the ongoing story of your portfolio, ensuring you’re always in the know. By harnessing these tools, you stay engaged and proactive, watching your investments flourish like a well-tended garden. Stay vigilant, stay informed, and let these dashboards guide your next strategic move.
real-time KPI dashboard for investments
As an affiliate, we earn on qualifying purchases.
As an affiliate, we earn on qualifying purchases.

Airport Finance and Investment in the Global Economy
As an affiliate, we earn on qualifying purchases.
As an affiliate, we earn on qualifying purchases.